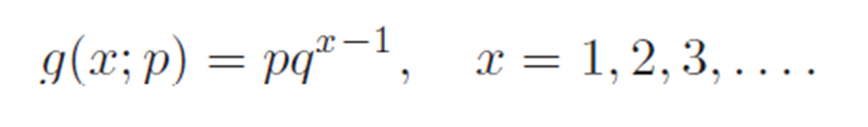
Geometric distribution is to model the random trial number X until a first success, in Bernoulli trial experiments, with constant success rate p. The probability of x can be calculated as
Geometric distribution is a special case of Negative Binomial distribution, which models the X trial is the n success trial.
R programming language provides function dgeom() for geometric probability computation. Next example shows the geometric probabilities for different number of X between 1 and 8 until a success trial in Bernoulli experiments, with success rate p = 0.15 for a single trial.
# create a vector for X series values
xtrial <- seq(1, 8, by = 1)
# Using dgeom() function to calculate probabilities for each value of Xtrial
#probability of x trials until getting a success
probtrial <- dgeom(xtrial, prob = 0.15)
probtrial
#output
[1] 0.12750000 0.10837500 0.09211875 0.07830094 0.06655580 0.05657243
[7] 0.04808656 0.04087358
# Plot probabilities
plot(probtrial) 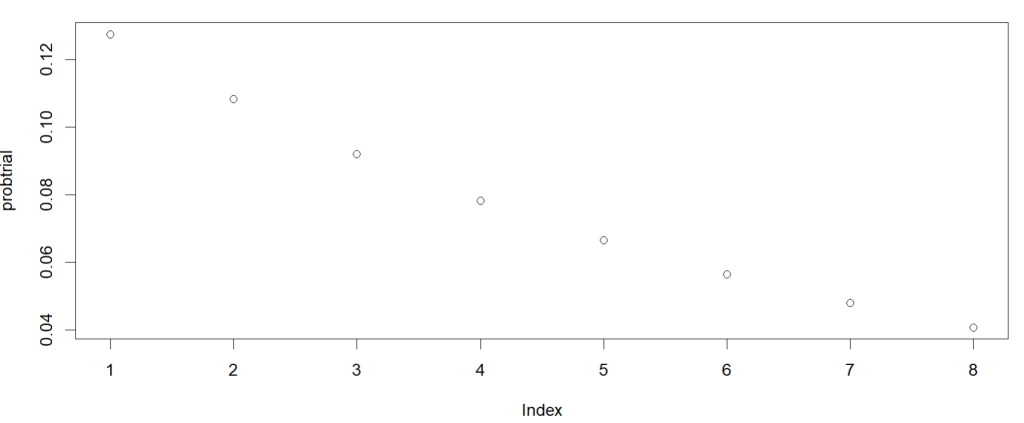
0 Comments